Wednesday, March 29, 2017

Day Eight - Thevenin's Theorem 3-28-2017

Today, we started off our day by solving a superposition problem as a review, and we even used everycircuit to verify the result.

Here is the picture of us using everycircuit to solve the problem.

After that, we talked about Thevenin's Theorem.
To me, Thevenin's Theorem is a important concept that all electrical engineer has to know because it gives engineer an easy tool to build a complex circuit in another form of existence.

Here is the picture of us solving the circuit using thevenin's theorem.

After the learning of the concept, we did our lab.
The purpose of this lab is to verify the thevenin's theorem by comparing the measured and calculated results.

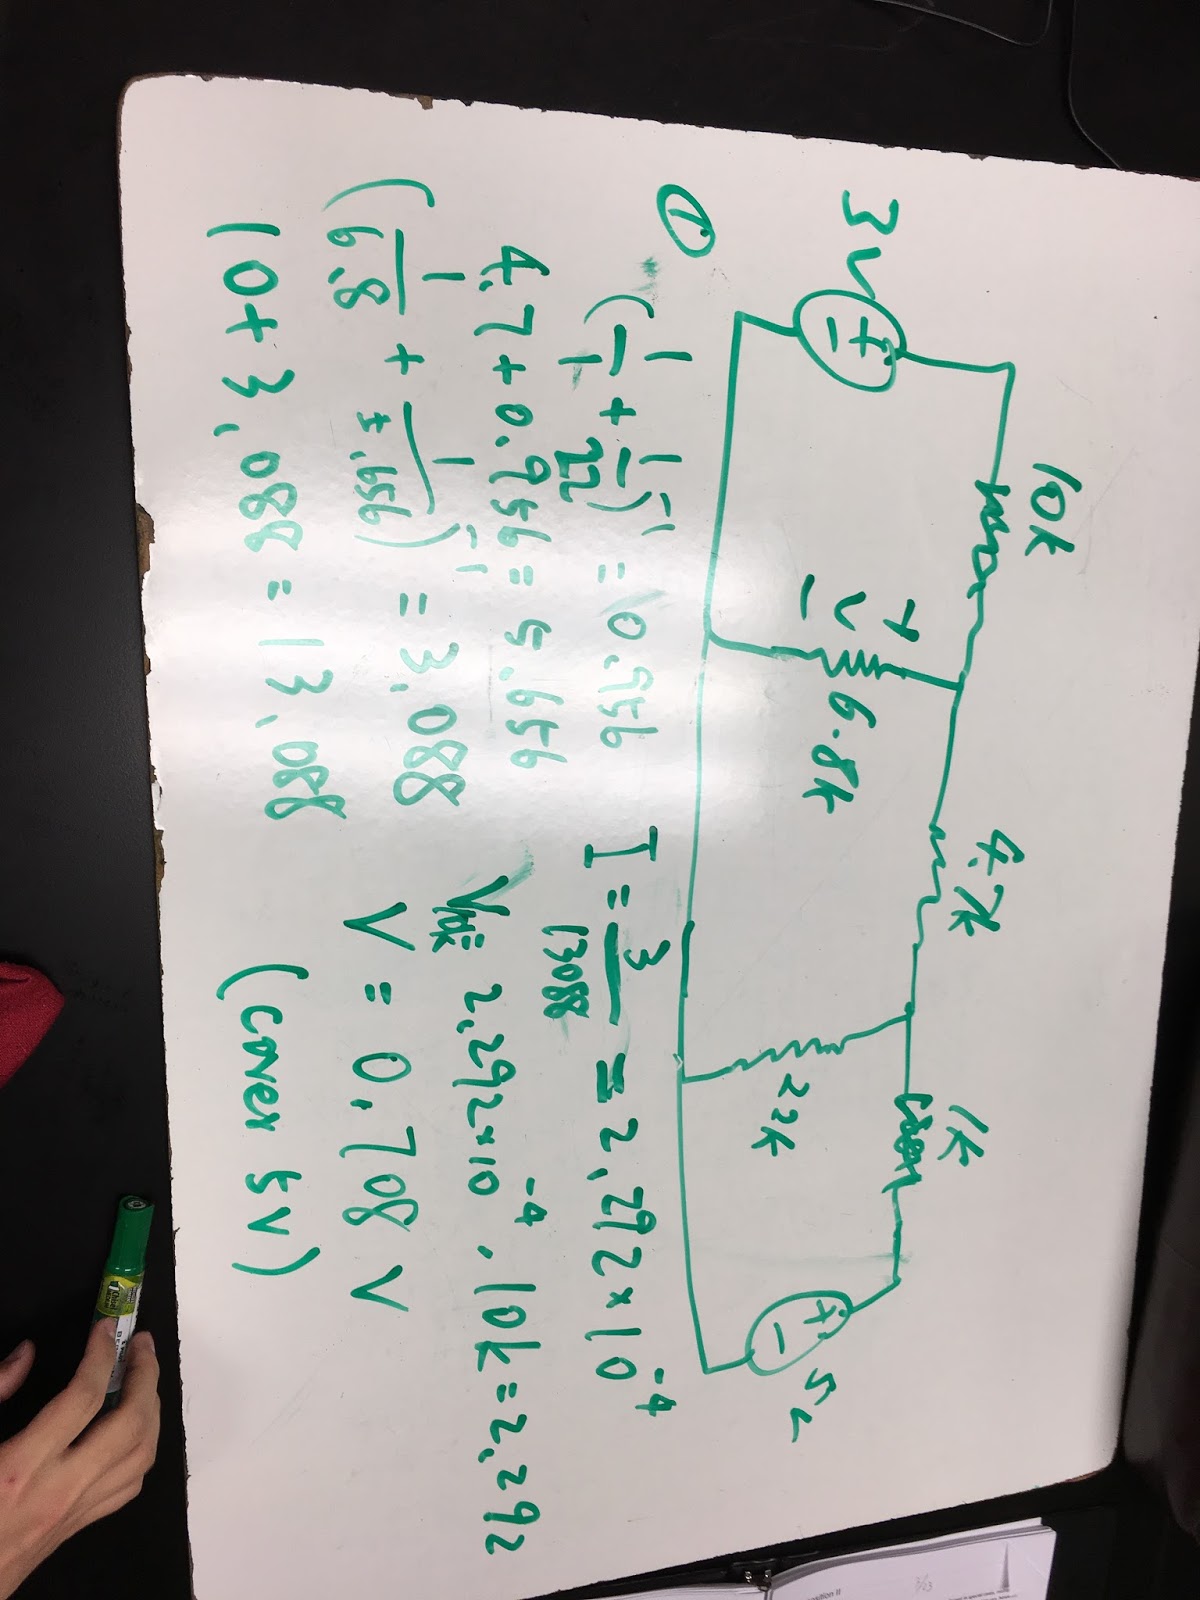
Here is the result that we calculated.

Resistance error for this lab:
1k(0.96k), 2.2k(2.15k), 4.7k(4.6k), 6.8k(6.68k), 1.8k(1.74k), 6.8k(6.68k)

Our measured values for the Thevenin resistance and the open circuit voltage is 7.2kohms and 0.448volt, which compares to the calculated value (7.7kohms and 0.46volt), and they have 6.49% and 2.6% of error.

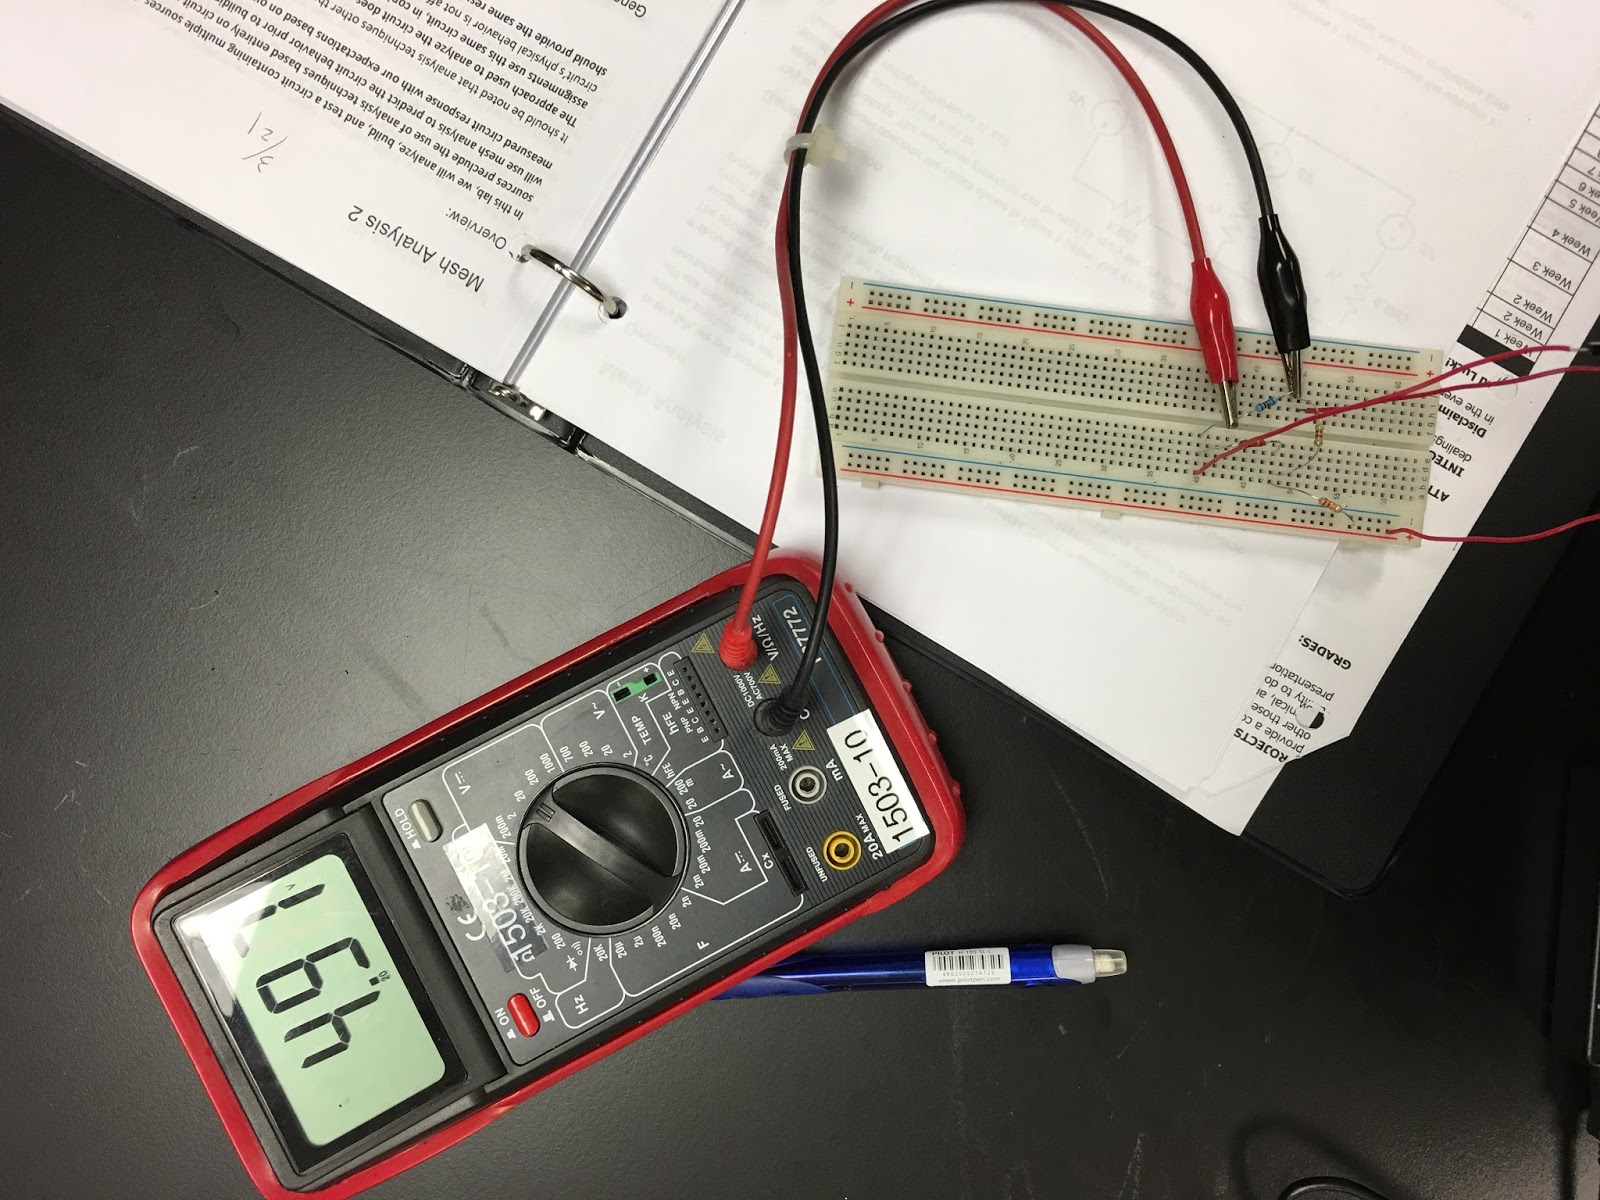
Here are the photos of us actually taking the data from the circuit.

On part three, we chose a 4.5k ohms resistor as our load resistor, and we calculated that the voltage across the load will be 0.187volt, and from our measurement, we have 0.165volt. The error yields at around 11%, which is not very precise because the value of the resistors in our calculation are different than the actual values of the resistors.

On part four, we used the potentiometer to generate our measured values of thevenin resistance 7.2ohms, then we supply the circuit with the designated value of voltage which is 0.488 volt. After that, we put the same resistor that we used as a load in part three into the thevenin circuit, and we get the voltage drop is 0.167volt, and if we compare this value to our calculation, the error yield is 1.1%.


For part five, our potentiomenter created a big challenge to us because it only allow 8.5k ohms as the maximum resistance, so we are not able to create a bell curve which we suppose to find from the data.


Summary: 
Today, we learned about thevenin's theorem which is helpful for engineer to build a simple circuit to represent a complex circuit. In our experiment, the calculation and measurement both match up with each other, so I think it is a very useful tool while implementing in real life situation. For the maximum power of the load resistance, it exists when the load resistance is the same as the thevenin resistance. Before and after the value, the curve will be smaller than that because it is a concave down curve.


Tuesday, March 28, 2017

Day Seven - Linearity and Superposition 3/23/2017

Today, we talked about linearity and superposition which can be used to solve complex circuit.
However, I thought it is more complicate than other circuit analysis method because it gives us multiple of circuits that we need to solve, but I also know that it is a convenient method to solve big and complex circuit.

First, we had our linearity problem. Note that as the Vs is doubled from 12 to 24, the current I also doubled because of the linearity property.

Here is the example of superposition. We first have to ignore all the independent sources except one. Then we use basic circuit analysis technique to solve for the voltage or the current that we need in the specific location. After that, we ignore the source we just use, and using another source as the source of the renewed circuit. Also calculate the voltage or current at the same specific location. Finally, we add up the contributions of both circuits at that specific location to get the actual value.

After that, we had our superposition lab.
Pre-Lab: we have to calculate the Voltage drop at the 6,8k resistor in the circuit above.
From our calculation, the voltage drop across the 6.8k resistor in the 3V voltage source circuit is 0.708V, and 1.99V in the 5V voltage source circuit. Adding up both contributions at the 6.8k resistor, we have 2.707 voltage drop across the 6.8k resistor,

Resistor Error:
9.8k(10k), 4.6k(4.7k), 0.975k(1k), 6.5k(6.8k), 21.7k(22k)

By measuring the voltage across the 6.8k resistor, we measured that 0.693V in the 3V voltage source circuit and 1.96V in the 5V voltage source. The sum of the voltage is 2.66V.
Combining both circuit, we have 2.65V of voltage drop across the 6.8k resistor.


MeasuredExpected Source
1.96volt 1.99volt 5V
0.693volt 0.708volt 3V
2.66 2.707 Total

Summary: I personally prefer other analysis techniques over superposition because it seems involving more circuit in the calculation than usual. However, this basic calculation using the linearity of the circuit can give us precise result on complex circuit, and this can be shown by the experiment.

Tuesday, March 21, 2017

Day Six - Mesh Analysis Lab and Time Varying Signal 3/21/2017

On day six, we started off our day by giving us a circuit that required to be solved with mesh analysis.
Using mesh analysis with KVL to solve the circuit.

After that, we have our first experiment using mesh analysis.
First, we calculated the expected value of V1 first.
From our calculation, we expected V1 to be 5volt and I1 to be -0.3224*10^-3.

However, from our experiment, we measured that V1 is 4.97 volt and I1 is -0.00320.
Percent error is very low for this experiment (-0.6% and 0.7%).

After that, we had our design problem of the transistor.
Since the larger the transistor, the more heat it can take but also the more expensive the transistor, we have to calculate the power output of the transistor before using it because like I said, if the power is larger than the maximum amount the transistor can take, the transistor might blow up.
Our calculated value of the power output of the transistor is 4.266*10^-2 Watt, so we decided to use T092 transistor which is cheap and doable at this power output.

After this calculation, we had our second lab, time varying signals, which purpose is to show the oscillation of the voltage.
Here is the setup of this lab.
Sinusoidal wave 
Square wave
Triangular Wave.

We can see the different shape of the wave. The square wave has the fastest rate of change.

Summary: Today, we talked about mesh analysis and how to implement it into the real circuit.
We also learned about transistor and how to design the circuit if we want to put a transistor into the circuit. The bigger the transistor, the more power input it can handle, however, it will be more expensive at the same time, so designing a circuit with appropriate size of transistor is important.
After, we also learned the different shape of the voltage graph. It depends on the pulse of the time varying machine. 

Friday, March 17, 2017

Day Five - Nodal Analysis Lab and Mesh Analysis Lecture 3/16/2017

Today, we talked about Nodal Analysis in our experiment.
Here is the schematic of the circuit.
Pre-Lab:
The measured resistances are 21.6k for 22k, 6.4k for 6.8k, and 10k for 10k ohms resistors.
Using Nodal Analysis, we calculated that the V2 = 4.424 and the V1 = 2.424.
This is the setup of this experiment.
Measured values for the voltage V1 and V2 are 4.34 and 2.37.

These images show the measured voltage across the 20k and 6.8k resistors.
Percent error:
For V1, the percent error is -2.2%
For V2, the percent error is -1.9%

After this lab, we did some mesh analysis questions.
Here is the circuit, and we separate this circuit into three meshes.
For mesh, the total V is equal to zero, so using KVL is an easy approach to this problem.
Another problem that require mesh analysis.
For two meshes circuit, we can see that using mesh analysis might be a little bit overkill because it requires more equation than using nodal analysis.

Summary:
Nodal Analysis is practical on real circuit situation as we can see that from our lab. The percent error is very low that it is acceptable. For a circuit that has many meshes, we should use mesh analysis.
Like the example we did in class, mesh analysis is useful on the circuit that has no current source and has many meshes; otherwise, other methods such as nodal analysis should be considered.

Monday, March 13, 2017

Day Four - Temperature Measurement System 3/9/2017

Hello Guys, in day four of our ENGR 44 class, we first had our experiment, and we talked about nodal analysis.

For this lab, we are asked to solve a design problem which electrical engineer will always face in their career. The problem is to find a value for R so that Vout increases by a minimum of 0.5V over a temperature range of 25 degree Celsius to 37 degree Celsius.

PreLab:
Using Voltage Divider to get the R in different situations.
I
In our case, we want 0.5 volt voltage increase on our output from 25 to 37. 
First we calculate the resistance of the thermistor at room temperature, we had 11k ohms.
Second we calculate the resistance of the thermistor at human temperature, we had 7k ohms.
Now we compare these two values using Voltage Divider to get the output difference of 0.5v.
From calculator, we had two resistance value (17633 and 4367 ohms); however, we chose the average of these two resistance (10k ohms) because it is the most accurate value from the bell curve.

From Measurement:
For our thermistor, in room temperature, the thermistor has 9.9k ohms; furthermore, in human temperature, the thermistor has 5.9k ohms. For our 10k ohms resistor, we measured that it has 9.8k ohms.
The output voltage at the high temperature condition is 2.46v and at the low temperature condition is 3.09v, so the voltage difference is 0.65v which passes the requirement for the design. 
Using the equation from the prelab, the calculated value of using 9.9k/5.9k ohms thermistor and 9.8k ohms resistor in circuit has a 0.633 output voltage.
Percentage difference is very low in this lab, it is around 2.65%.
Based on the calculation and implementation, we think that our design has met the design requirement, which is a minimum of 0.5V increase of 25 to 37.
If we need a more sensitive device that has at least 0.1V/degree Celsius, we are not able to design it with the current thermistor because it only has maximum 0.64 voltage increase.


Concern:
When we are using our finger tip to increase the voltage, our human temperature might not be as high as 37 degree Celsius; therefore, the output voltage can be much larger. Similarly, when we are waiting for the thermistor to cool down, the actual temperature on the thermistor might not be 25 degree Celsius. Also, the thermal conduction might take time for heat to transfer from our finger tip to the thermistor.

After the lab, we learned about nodal analysis, which I hate.
We are using the voltage difference between a voltage node and a non reference node to calculate the current flowing on that element.
Then using KCL to derive multiple equations from the circuit, and calculate the voltage.

Summary:
We learned about nodal analysis to deal with circuit that is problematic to solve using KCL and KVL.
Also, we learned to create our own temperature sensor device. From this device, we conclude that we are not always able to meet the design requirement. In reality, we have to know the reason of it and we must learn to explain to the customer when these situations are encountered.

Tuesday, March 7, 2017

Day Two - Dependent Sources and MOSFETs 3/2/17

Today, we did two labs. One of the labs is Voltage-Current Characteristics, and another is Dependent Sources and MOSFETs.
At the beginning of the class, our warm-up problem is:
The answer is even if the switch is turned ON, there is no change in the circuit because the potential drop remains the same as the potential in a battery is equal to the potential of the light bulb.

After that, we have our first lab - Voltage-Current Characteristics.
In this lab, we have to find the relation between current and voltage under a constant resistance.
The circuit diagram is:
Under the consideration of uncertainty, we measured the resistance of the resistor, and we get 98.7 ohms for a 100 ohms resistor. 
By changing the voltage of Vs, we are changing the current in the circuit and thus changing the voltage drop between the terminals of R.
Measured Data:
As we vary the Vs, the calculated V and I also vary.

We collected five values of voltage and current with different controlled Vs.
The graph does look like the current and voltage have a direct proportional relationship.
We further explore on this topic, and we find that the equation of this graph is:
y = 97.7811x + 0.0442
As the slope of this graph is the resistance of the resistor, we can find that there is some percentage error between our calculated value and measured value, but the relation between voltage and current still holds.

After that, we had our second experiment using MOSFETs.
MOSFETs stands for Metal Oxide Semiconductor Field Effect Transistors, and it is a voltage controlled current source.
Here is the setup of the experiment.
By changing the voltage applying to the gate of MOSFET, we are able to change the current through the drain and source. Increasing the voltage allows a stronger field for current to flow.
Here is the data we collected by changing the Vg.
We analysed the data by plotting the curve out.
From here, we can see that there is no rapid increase until the voltage is close to 0.7 volt.
Therefore, we can conclude that 0.7 volt is the threshold voltage required to operate the MOSFET.
We can also conclude that the MOSFET is a voltage controlled current source because as voltage changes, the current will also change. 
Our calculated g value is around 49.8605 by best fitting the "linear part" of the curve.

Note: the increment is not by 0.3 because we might have picked up a bigger resistance in our experiment, and the difference between the applying voltage and the voltage of the drain is so big that only a small applying voltage will control the current. 

Summary:
In day two, we learned about the relation between voltage and current is direct proportional if a constant resistance is used. We also learned that MOSFET is a voltage controlled current source because as we change the voltage at the gate, the allowed current go through from the drain to the source is going to increase; however, applying low voltage to the MOSFET might not allow current to flow because there is a threshold voltage in the MOSFET.

Day Three - Dusk-to-Dawn Light & BJTs 3/7/17

Hey guys, today we first had our amazing hot dog experiment.
I think the purpose of this experiment is to let us know that the hot dog will burn out eventually, and as the hot dog burn out, there is no more current going through, which implies there is current going through the LED as well.

Secondly, we had some calculation on finding the equivalent resistance of a circuit, and we also use KVL and KCL to find some values with some unknowns.

Here is how we calculate the equivalent resistance. We dissect the circuit into three parts, and we calculate the resistance of each part.

Thirdly, we had our experiment of the light sensor. As we change the light around the photocell, we are changing the resistance of the photocell and thus the current. Please note that there is an inverse relationship between the resistance of the photocell and the light surrounding the photocell.

Since we have resistances of 0.9k ohms and 10k ohms, we use these data for our calculation instead of 5k and 20k.

Note: this is the calculation we have using KVL; however, in our case, we are using 0.9k and 10k ohms instead of 5k and 20k ohms. 

By using 0.9k (exposed to light) and 10k (covered by hand) ohms resistors for the photocell in the calculation, we get Vb = 0.4128v for 0.9k resistor and Vb = 2.5v for 10k resistor.
In our measurement, Vb = 0.4v when exposed to light and Vb = 1.92v when covered by hand.
For the first situation (exposed to light), the voltage difference is only 0.0128v, we can conclude it is accurate from that; however, for the second situation, the voltage difference is 0.58v, which is around 25% of difference, and we conclude that it is inaccurate because this significant percentage difference can be resulting from the different lighting environments during the measurement of the photocell and the actual implementation of the circuit.


Here is a video of the functioning circuit.

Summary:
On day three, we learned to use Bipolar Junction Transistors, which is a current controlled current source in our light sensor device. As the photocell is covered by hand, the resistance of the photocell increases to 10k, and the increase in resistance induces a smaller current flowing through the 10k resistor and the photocell; in addition, as smaller current flow through the 10k resistor, the voltage drop across the 10k resistor is half of the voltage source 5v, which implies there 5 voltage drop across the base and the ground. Since the diode inside the BJT requires 0.7 voltage difference between base and emitter in order to let the current flow from the collector to the emitter, this sufficient voltage controlled by current will induce another current flowing through the transistor, and this is the whole idea of BJT. 

Wednesday, March 1, 2017

Day One - Breadboard, short and open circuit 2/28/17

Today we used the breadboard and DMMs to experience short and open circuit.

In the first experiment, we connect two holes in the same row of the breadboard.

what we get from the first experiment is that the resistance is very low because it is a closed short circuit, and we get 0.01 Ohms of resistance.

In the second experiment, we connect two holes of opposite sides of the channel of the breadboard.
Here is the setup. We get an infinite amount of resistance of this one because the rows are not connected, so it is an open circuit.

In the third experiment, we connect two arbitrary holes, and we get infinite resistance because again they are not connected, which means it is an open circuit.

In the fourth experiment, we connect two holes in rows on opposite side using the jumper. We get small resistance on this one because the jumper creates the connection between the two holes, which makes it a closed circuit with low resistance. 
We get 0.05 Ohms of resistance.

Summary: In this lesson, we learned how to distinguish open circuit from short circuit, and we have a detailed understanding of how the equipment work. For example, solderless breadboard is a convenient way to create a circuit, and voltmeter is an efficient method to measure the voltage.